


The Issues | What We Know | December 2017
Issue Brief
●●●●
Responses to and Repercussions from Income Volatility in Low- and Moderate-Income Households: Results from a National Survey
● Summary
Income volatility—the often-unpredictable fluctuation of cash inflows over time—is a fact of life for many low- and moderate-income (LMI) Americans. In the previous brief in this series, the analysis of a national survey revealed roughly one-third of LMI individuals experienced income volatility over the 6 months prior to the survey. This finding was consistent with other research that has attempted to measure the prevalence of volatility in the U.S.
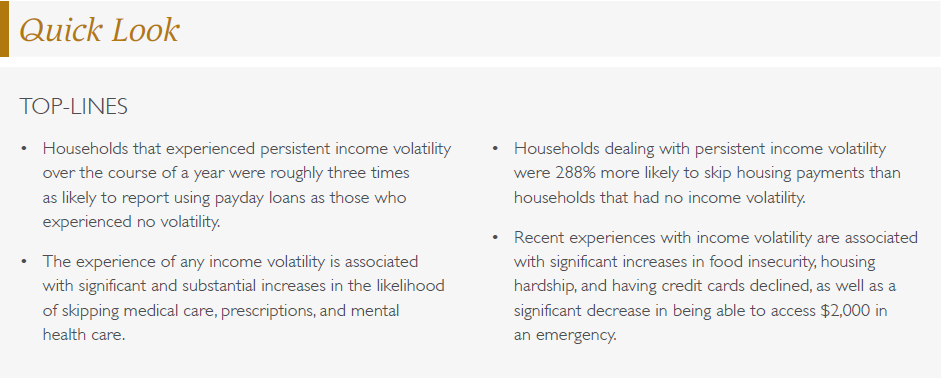
Less well-researched, however, is the effect income volatility has on Americans’ financial lives. It is presumed that volatility makes saving, asset-building, and planning for the future more difficult for LMI households. It is also assumed that volatile incomes force some individuals to turn to credit card debt or alternative financial services (AFS) like payday loans to bridge the gaps in their finances. And it would logically follow that volatile finances also result in more severe “real world” hardships like food insecurity, housing instability, and foregone medical care.
However, the evidence to back these assumptions is limited. Research has found that households using AFS do so to make up for lost income or to cover daily living expenses, and that nearly one-third of households turn to alternative sources of small-dollar credit to cover expenses when household cash flows are misaligned. The U.S. Financial Diaries, which tracked the finances of 235 LMI households over the course of a year, similarly found that many families dealing with income volatility turned to shortterm credit to make ends meet.
Regarding the potential impacts of volatility on household financial wellbeing, the most recent Survey on Household Economics and Decisionmaking found that 40% of those with volatile monthly incomes reported that they struggled to pay their bills as a result of the volatility. Black and Hispanic families were especially likely to report having experienced this volatility-induced hardship. Research from the Pew Charitable Trusts found that families with year-to-year income volatility were more likely to face financial shortfalls like missing a mortgage payment and less likely to report that they had savings and that they could come up with $2,000 in an emergency than those with stable incomes. Additionally, research has found that service sector workers with volatile weekly earnings are more likely than their peers with stable pay to experience material hardship like going hungry, to have difficulty meeting monthly expenses, and to use AFS like payday loans.
Furthermore, many studies reveal a relationship between financial shocks—usually defined as a large, one-time drop in income or spike 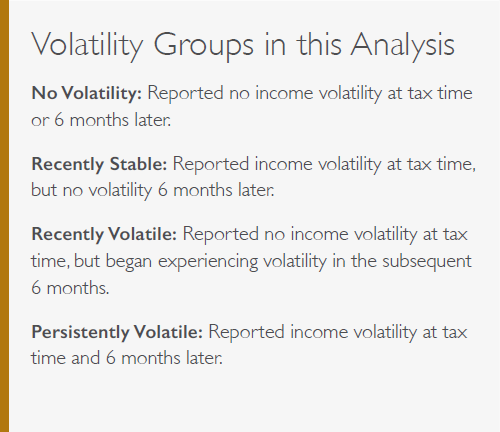 in expenses—and material hardship and food insecurity. However, volatility is associated with more chronic fluctuations, so research on financial shocks may not be directly applicable to families with chronically-volatile incomes.
The purpose of this brief is to add to this emerging literature by analyzing respondents’ answers to both waves of the 2016 Household Financial Survey (HFS), which was conducted as part of the Refund to Savings (R2S) Initiative. These survey data are particularly valuable because they capture a wide array of financial metrics on a population often difficult to study on a large scale, and it also tracks these metrics over time. The data do not lead to causal inferences about the relationship between volatility, financial behaviors, and financial outcomes; however, they do offer insights into correlations between these indicators. We also capitalize on the measured change in financial volatility over time to assess the relationship between the incidence of volatility and financial outcomes.
The brief will proceed as follows. First, we will describe the HFS and the measures of income volatility we use for this analysis. Next, we will report the findings of our analysis, noting the relationship between income volatility and financial outcomes as well as material hardships. Finally, we will discuss the context and implications of the results.
● Background
This is the second in a series of briefs produced by a partnership between the Aspen Institute’s Expanding Prosperity Impact Collaborative (EPIC), Washington University’s Center for Social Development (CSD), and the Intuit Tax and Financial Center. The first brief highlighted new data on the prevalence of income and expense volatility in low- and moderate-income households. This brief will focus on the potential consequences of volatility and how it relates to financial behavior.
● Issue Brief
RESEARCH BACKGROUND AND METHODOLOGY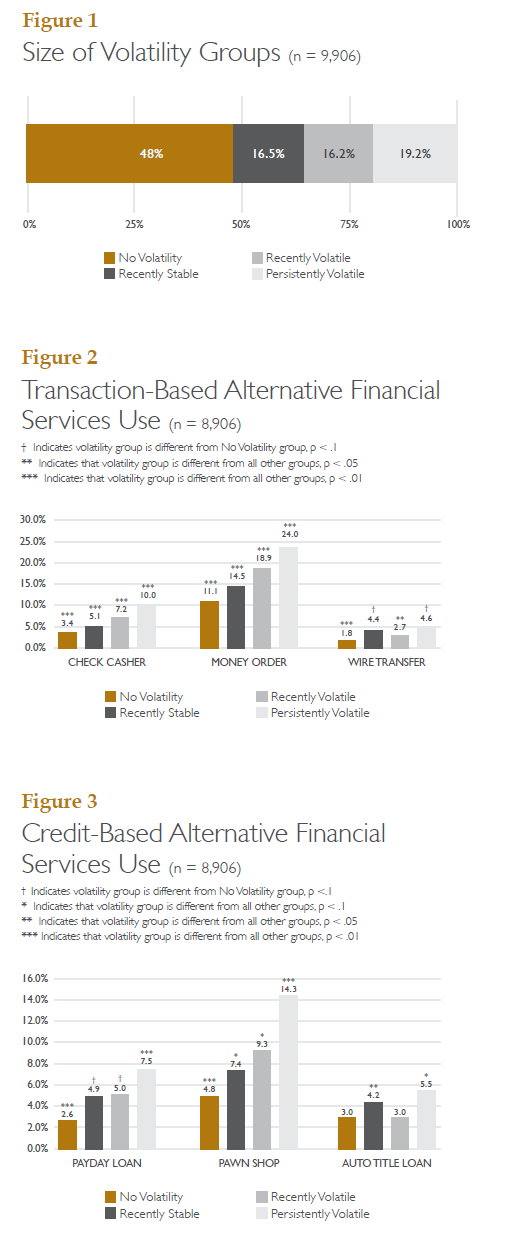
This brief uses data obtained through the 2016 iteration of the R2S Initiative, which uses behavioral economics to encourage TurboTax Freedom Edition (TTFE) filers to save their tax refunds. R2S is a collaboration between Washington University in St. Louis, Duke University, and Intuit Inc., the maker of TurboTax. Through an ongoing series of randomized, controlled trials, R2S tests the impact of behavioral interventions on users of the TTFE tax-filing software, offered as part of the IRS Free File Alliance. The software is free to households that meet certain eligibility standards: In 2016, a household was required to have an adjusted gross income of $31,000 or less, be eligible for the Earned Income Tax Credit, or include a member who was on active military duty and had an adjusted gross income less than $61,000.11 A recent report on the R2S Initiative provides more details on the study and its methods.
The analysis in this brief uses data from the HFS, which is the survey component of R2S. Upon completing their taxes, half of TTFE filers who received tax refunds were selected randomly to participate in the survey. Six months later, survey takers were invited to take the second wave of the survey to measure how outcomes changed in the months after taxes were filed. With taxpayer consent, survey responses were matched with the individual’s tax data collected by TTFE. The analytical sample for this brief consisted of the 8,906 LMI households that completed both waves of the survey.
The HFS measured respondents’ subjective perceptions of income volatility at both points in time with the following question: “Which of the following best describes your household’s income over the last 6 months?” Three response options were offered to this question:
- "Roughly the same amount each month”
- “Roughly the same most months, but some unusually high
or low months” - “Often varies quite a bit from one month to the next”
Households that reported having “some unusually high [income] or low [income] months” or having income “vary quite a bit from one month to the next” were categorized as having income volatility at that point in time. Households claiming that their incomes were “roughly the same amount each month” were categorized as having no present income volatility.
Our analysis divides survey respondents into four classifications depending on their experience with income volatility. The first group, “No Volatility,” consists of households that reported experiencing no income volatility in either wave of the survey. The second group, which we refer to as “Recently Stable,” includes households that reported having income volatility in the first wave of the survey but had no volatility in the second wave. The third group is “Recently Volatile,” which includes households that had no volatility in the first wave but reported volatility in the second wave. The final classification is “Persistently Volatile.” This group contains households that reported experiencing volatility in both waves of the survey.
By splitting HFS respondents into these categories, we can better understand the specific relationships between the experience of income volatility and key household outcomes over time. In the Results section below, we compare how various hardships differ between the volatility groups. To ensure that they are representative of all LMI households in the United States, all descriptive results have been weighted using data from the Census Bureau’s 2015 American Community Survey.
RESULTS
In this section we first describe the households in each of the volatility groups. We then subsequently examine how the experience of hardship differs for households in each of the volatility groups.
WHO EXPERIENCES DIFFERENT TYPES OF VOLATILITY?
Figure 1 compares the sizes of the four volatility groups. The largest volatility group is made up of households reporting no volatility in both waves of the survey. Notably, this group is nearly as large as all of the other volatility groups combined. Of households that did experience income volatility, persistent volatility was the most the common with almost one-fifth of households reporting volatility across both survey waves. The Responses to and Repercussions from Income Volatility in Low- and Moderate-Income Households: Results from a National Survey number of recently stabilized households was similar to the number of recently volatile households.
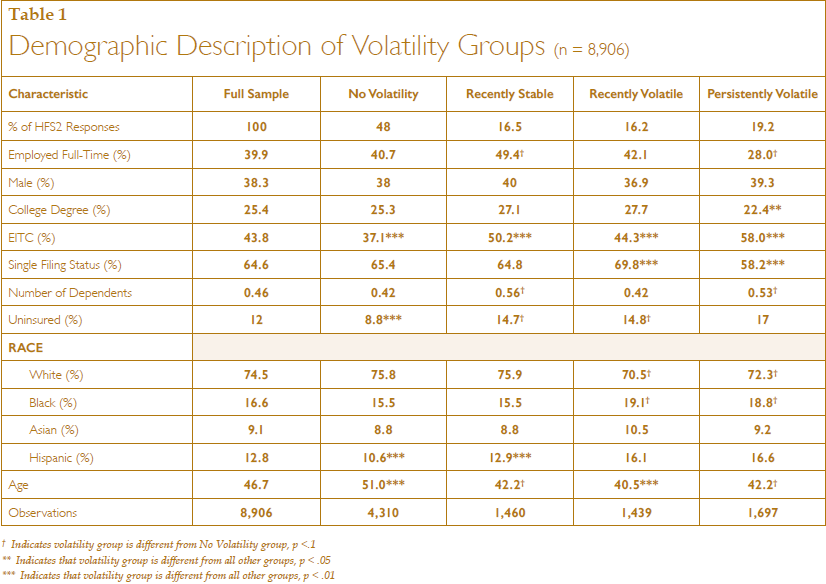
Table 1 compares the demographic characteristics of the volatility groups. Households experiencing volatility tend to be younger than households without volatility. Households with more persistent and more recent experiences of volatility are less likely to have health insurance and are more likely to be recipients of the Earned Income Tax Credit. These households are also less likely to be white. Interestingly, households with no reported volatility have lower rates of employment than recently stable or recently volatile households, potentially because households with no volatility likely include the longterm unemployed or students who do not earn much income.
WHAT IS THE RELATIONSHIP BETWEEN THE EXPERIENCE OF INCOME VOLATILITY AND HOUSEHOLD FINANCES?
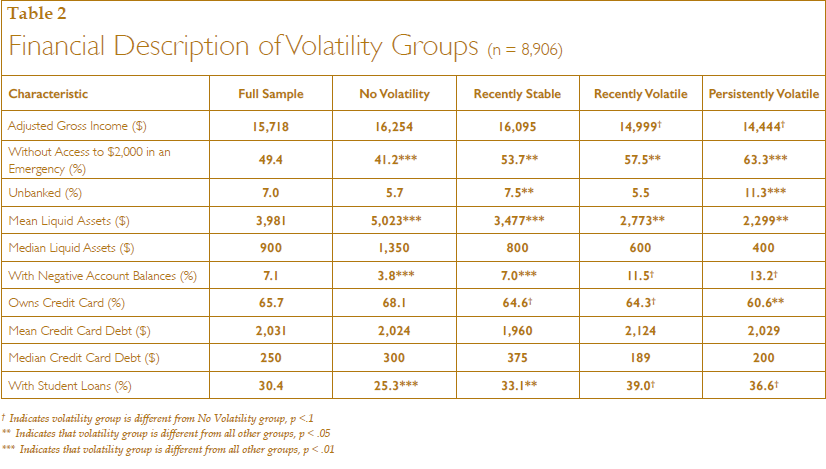
Table 2 shows how the financial characteristics of the volatility groups differ. Across nearly every measure in this table, financial conditions are worse for households with more intense and more recent experiences of volatility. To understand the relationship between volatility and these financial indicators, it is perhaps most instructive to compare households that experienced no volatility over the two survey waves to those that experienced it in both waves. Households facing persistent volatility were over 50% more likely to lack access to $2,000 in emergency resources, were around twice as likely to be unbanked, were around 350% more likely to report negative account balances, were almost 50% more likely to report student loan debt, and had less than one-third the median level of liquid assets.
Interestingly, the exception to this trend is in levels of credit card debt. Credit card debt (and credit card ownership, to a degree) is roughly stable across the different volatility groups. This could reflect a complex relationship between volatility and debt. On the one hand, volatile households may lack the ability to access as much credit as stable households, which leads to less potential to incur credit card debt. On the other hand, volatile households may need to rely on credit more to offset the fluctuations in their income.
HOW DOES INCOME VOLATILITY CORRESPOND WITH ALTERNATIVE FINANCIAL SERVICE USAGE?
The above results demonstrate that exposure to income volatility is associated with constraints on liquidity, particularly in terms of access to $2,000 in an emergency and liquid asset holdings. These constraints may lead to households relying on AFS as a source of liquidity to either cope with an emergency or as part of their general financial management strategy. Figures 2 and 3, which examine the usage of transaction-based (e.g., check cashers, money orders) and credit-based (e.g., payday loans, pawn shop loans) AFS, show that reliance on AFS is strongly associated with a household’s experience with volatility.
 Interestingly, this strong relationship holds for both transaction- based and credit-based AFS use. Figure 2 shows that, in the 6 months after filing their taxes, households with persistent volatility were nearly twice as likely to use check cashing services as recently stabilized households, and they were almost 3 times more likely to use check cashing services than households that never reported experiencing volatility. These results may be a function of the general lack of access to traditional banking services faced by households with volatile incomes, as shown in Table 2 above.
Figure 3 examines how the volatility groups use AFS as a resource for liquidity. Households with persistent volatility are nearly 3 times more likely to use payday loans and pawn shop loans than households in the “No Volatility” group. These results demonstrate the degree to which persistent income volatility is related to a general strain on households’ finances and may lead some households to rely on AFS to meet their financial needs. These results also demonstrate how quickly volatility can lead to use of these services. The “Recently Volatile” group, which reported no volatility in the first wave of the survey but did report volatility 6 months later, was still roughly twice as likely as the “No Volatility” group to use many transaction- and credit-based AFS in the intervening 6 months between surveys. While the research in this brief is not intended to provide causal estimates of the relationship between volatility and household outcomes, this illustrates the potential short-term relationship between income volatility and a household’s behavior and well-being.
WHAT TYPES OF MATERIAL AND FINANCIAL HARDSHIPS ARE FACED BY HOUSEHOLDS EXPERIENCING INCOME VOLATILITY?
Income volatility introduces uncertainty into households’ balance sheets. Without the ability to plan for the future, saving can become difficult. Evidence for this association can be seen in Table 2 above, which shows that persistently volatile households had substantially lower levels of liquid savings and rates of being able to access $2,000 in an emergency. In the absence of liquid savings, households may be more likely to face hardships when emergencies arise because they lack the resources needed to effectively respond. In this section, we analyze how experiences of medical hardship, material hardship, and food insecurity differ across the volatility groups.
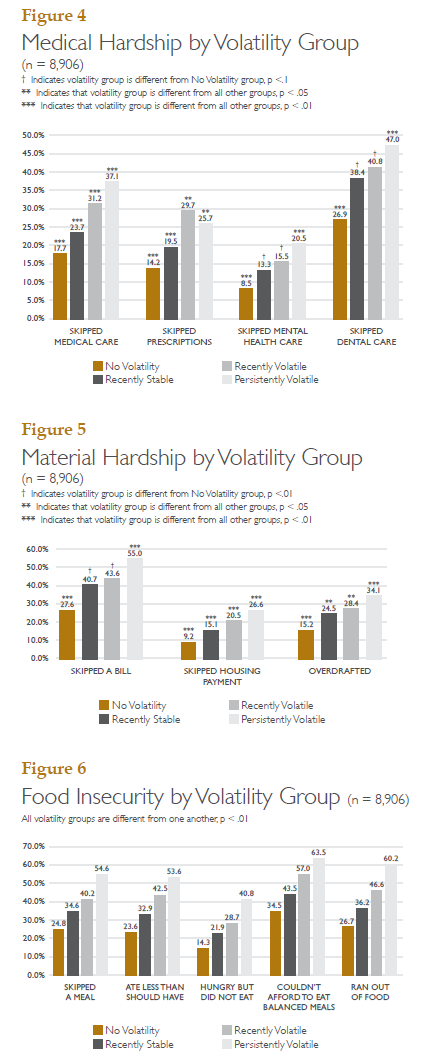
Figures 4 and 5 illustrate the different experiences of medical hardship and material hardship for each of the volatility groups. The findings in Figure 4 show that the experience of medical hardship is more common in households with more intense experiences of income volatility. In absolute terms, the starkest contrast is on the rate of skipped medical and dental care. The rate of skipping medical and dental care was nearly 20 percentage points higher for persistently volatile households than it was for households that had no volatility. Notably, compared with households that reported no volatility, persistently volatile households were 244% more likely to skip mental health care.
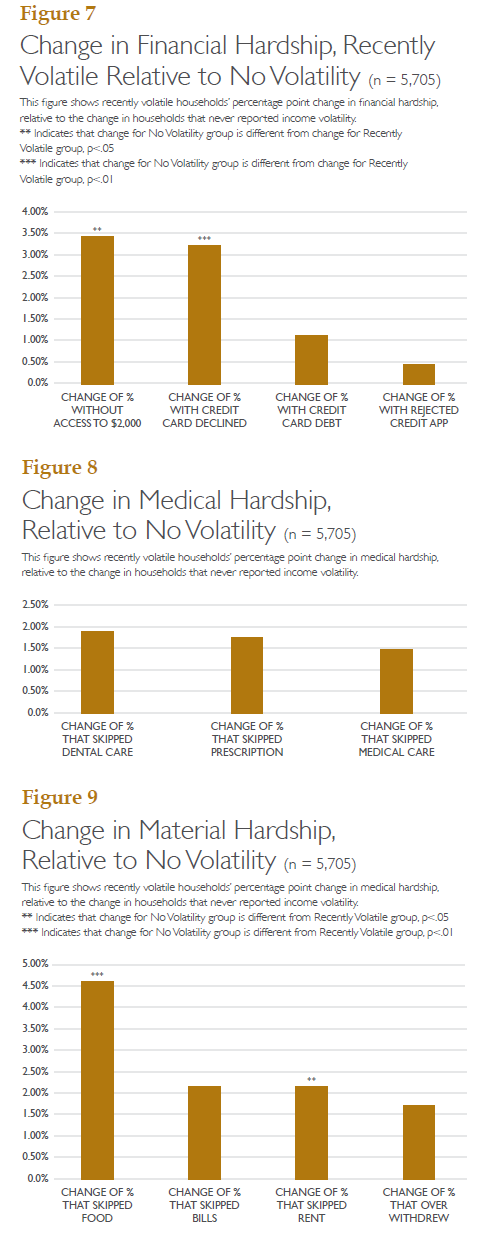 Figure 5 shows the rates at which households in each volatility group experienced three different types of material hardship. As with the experience of medical hardship, the experience of material hardship is more common in persistently and temporarily volatile households than it is in households that do not experience any volatility. Compared with households
that did not experience any volatility, households with persistent volatility were about twice as likely to face each type of material hardship. The material hardship with the greatest disparity across volatility groups was skipping a housing payment. Households dealing with persistent income volatility were 288% more likely to skip housing payments than households that had no income volatility.
While Figures 4 and 5 indicate that volatile households are missing essential financial obligations, Figure 6 shows that another essential aspect of life impacted by volatility is food security. In the 6 months after filing their taxes, over half of persistently volatile households skipped meals, ate less than they should have, could not afford to eat balanced meals, and ran out of food prematurely. Compared with households with no income volatility, households with persistent volatility were more than twice as likely to experience all but one of the measures of food insecurity. Notably, the disparity between recently stable and persistently volatile households was also stark. Households with persistent volatility were 41% more likely to experience any form of food insecurity than households that reported experiencing volatility only in the first wave.
WHAT ARE THE IMPACTS OF VOLATILITY OVER TIME?
In this section, we compare changes in hardship rates in households that do not experience volatility in either wave of the survey with changes in hardship rates in recently volatile households. By tracking the changes in hardship rates for these groups from Wave 1 of the survey to Wave 2, we can better isolate the trends in household outcomes as they relate to the experience of volatility. For example, if all households, including those that are not experiencing volatility, have seen an increase in financial and material hardship over the previous 12 months–perhaps because of macroeconomic conditions affecting the country–we might be able to discount the influence of volatility.
However, we consistently find that the rates of hardship fall more–or rise less–in households that never report experiencing income volatility than they do in households that experience volatility only in the 6 months after tax filing. This implies that the experience of volatility may be leading to the hardships that these households are experiencing.
Figure 7 compares changes in financial hardship for households that never experienced volatility with changes in financial hardship for households that only reported experiencing volatility in the second wave of the survey. Households that never reported volatility and households that were recently volatile had statistically different changes in the rate of having access to $2,000 and the rate of having a credit card declined. In the 6 months after tax filing, the rate of lacking access to $2,000 and the rate of having a credit card declined increased by over 3 percentage points more in households that were newly volatile than they did in households that had no volatility.
Figure 8 shows changes in the experience of medical hardship for households that had no volatility and recently volatile households. When compared with households that experienced no volatility in either wave of the survey, households that experienced volatility only in the second wave saw less of a decline in each measure of medical hardship. The greatest disparity was in the number of people who skipped dental care—almost a 2 percentage point difference. However, the volatility groups’ changes in medical hardship were never statistically different from one another.
Figure 8 compares changes in the rates of material hardship for households that had no volatility with changes in rates of material hardship for recently volatile households. As with financial and medical hardship, households without volatility experienced greater reductions in material hardship compared with households that became volatile in the 6 months after tax-filing. The volatility groups had statistically different changes in both the rate of being unable to afford food and in the rate of skipping rental payments. Far and away the largest difference in changes was on the rate of being unable to afford food. Relative to households that did not report income volatility in either wave of the survey, households that had income volatility only in 6 months after tax-filing saw the rate of not being able to afford food increase by over 4.5 percentage points. When considered with the findings in Figure 6, this suggests that income volatility may be a major driver of food insecurity.
DISCUSSION
By combining longitudinal data on income volatility with detailed information on financial behaviors, this brief substantiates hypotheses about the relationship between volatility and financial wellbeing. Though we cannot say with certainty that income volatility is causing negative or costly economic outcomes, the associations are unmistakable.
While the focus of this brief is on income volatility, it is also important to note that households without income volatility are still financially vulnerable. Almost half of the sample experienced no income volatility, yet among this group the level of hardships is still high, with about a quarter skipping meals and 17% skipping medical care. Thus, solving volatility alone will not resolve completely the financial strain and hardships experienced by LMI households.
The households experiencing volatility are not facing this challenge in isolation. Instead, those with persistent income volatility also lack emergency savings and other liquid assets, and must often turn to high-interest credit and high-fee transaction services. As such, policymakers and the financial services ecosystem should not expect to be able to solve for LMI consumers’ credit, savings, or asset- building challenges without also tackling volatility, and vice versa. Indeed, the varied financial needs facing LMI consumers seem to call for more holistic solutions combining product categories that have historically been separated, like credit, savings, and insurance.
These data also begin to shed light on some of the potential downstream consequences of volatility. Volatility is strongly associated with skipping medical care, food insecurity, and material hardships like missing a rent or utility bill. Again, correlation does not mean causation, so it is possible that the hardships themselves—or other unobserved factors—are leading to volatility and not the other way around.
For example, health problems could lead to both skipped medical care and missed time at work, which, given the low prevalence of paid sick leave in many low-wage jobs, could result in missed wages and corresponding volatility. However, we know from the first brief in this series that income volatility is highly correlated with a lack of health insurance. Moreover, by comparing those who newly experienced income volatility in the last 6 months with those who have not experienced it at all in the last 12 months, we can see that volatility seems to be driving at least some of the skipped medical care (though the differences are not statistically significant). These findings argue for more robust research into the interaction between access to affordable medical care, including dental services, and income volatility.
Food insecurity is another area that deserves more attention. Our findings provide strong evidence that income volatility and food insecurity do in fact go hand-in-hand, and suggest that families, in part, cope with volatility by reducing food consumption. Future research should explore the role of volatility related to food assistance and, in particular, the Supplemental Nutritional Assistance Program (SNAP). Over 44 million LMI Americans received SNAP benefits in 2016. How beneficiaries qualify for and receive benefits could mitigate or exacerbate income volatility and food insecurity. This is especially true given the fluid nature of volatility on display in the data used in this brief: Almost a third of observed households moved between classifications of volatility, including those experiencing recent volatility or recent stability.
CONCLUSION
Overall, this brief, as well as the previous one in the series, demonstrate the prevalence of serious hardships associated with income volatility. However, more research is needed to tease out the direction of causation to inform interventions. We also acknowledge that the changing nature of work—towards a more gig-based, ad-hoc labor force—might make reducing the incidence of volatility more difficult, requiring public policy solutions more focused on how households plan for, cope with, and build a safety net for swings in income. Despite this, policymakers, financial product designers, and consumer advocates should not be paralyzed by uncertainty. Americans, especially LMI Americans, are facing urgent financial challenges that require creative solutions and a rethinking of old models that rely on outdated assumptions around static, stable income and expenses.
For Endnotes and Works Cited, please download the PDF version of this Issue Brief:
● Acknowledgments
DISCLAIMER
Statistical compilations disclosed in this document relate directly to the bona fide research of, and public policy discussions concerning savings behavior as it relates to tax compliance. Compilations are anonymous and do not disclose information containing data from fewer than 10 tax returns or reflect taxpayer-level data with the prior explicit consent from taxpayers. Compilations follow Intuit’s protocols to help ensure the privacy and confidentiality of customer tax data.
ACKNOWLEDGEMENTS
The Center for Social Development at Washington University in St. Louis gratefully acknowledges the funders who made the Refund to Savings Initiative possible: the Ford Foundation; the Annie E. Casey Foundation; Intuit, Inc.; the Intuit Financial Freedom Foundation; and JPMorgan Chase Foundation. The Refund to Savings Initiative would not exist without the commitment of Intuit and its Tax and Financial Center, including the dedication of our collaborators, David Williams, Melissa Netram, Joe Lillie, Krista Holub, and many others on the Intuit team who have worked diligently in planning and implementing the experiment. Lastly, we thank the thousands of tax payers who consented to participate in the research surveys and shared their personal financial information.
The Aspen Institute Financial Security Program (FSP) gratefully acknowledges the funders who make the Expanding Prosperity Impact Collaborative possible: the Ford Foundation, JP Morgan Chase & Co., and the W.K. Kellogg Foundation. Aspen FSP would also like to thank Ida Rademacher, Joanna Smith-Ramani, and Katherine Lucas McKay for reviewing earlier drafts of this work and providing valuable feedback.
The Intuit Tax and Financial Center gratefully acknowledgesthe TurboTax Freedom Edition customers who shared their data for research purposes and, in doing so, made this research possible. We thank the many employees at Intuit who enabled the Refund to Savings initiative. We also wish to thank the Free File Alliance for their work in making tax prep software available for free to low- and moderate- income households. Finally, we greatly appreciate our Refund to Savings partner—the Center for Social Development at Washington University in St. Louis—and the team’s dedication, insights, and rigorous research investigations. At Intuit, we aspire to Power Prosperity Around the World and we are thankful to have customers, employees, and partners advancing that mission with us.
The findings, interpretations, and conclusions contained in this report—as well as any errors—are the authors alone and do not necessarily represent the view of the authors’ organizational affiliations, those organizations’ funders, or this brief’s reviewers.
●●●●
●●●●
EPIC is an initiative of the Aspen Institute's Financial Security Program.

CONTACT US:
The Aspen Institute
2300 N Street, NW Suite 700, Washington, DC 20037© The Aspen Institute 2017—All Rights Reserved